
MSA
Trust your measurement system — is your data fit for decisions?
MSA evaluates how reliable your measurement system (gauge + operator + method) is through Gage R&R, bias, linearity and stability analyses.
Advantages of using it digitally
- Gage R&R, bias and linearity are calculated automatically; charts appear instantly.
- %GRR and ndc instantly — the accept/reject decision becomes objective.
- All studies are central and traceable with operator and date.
- Results flow digitally into SPC and Cpk studies.
How it works
Assess your measurement system's reliability in a few steps — from study setup to the %GRR result and report.
-
1
Open the panel
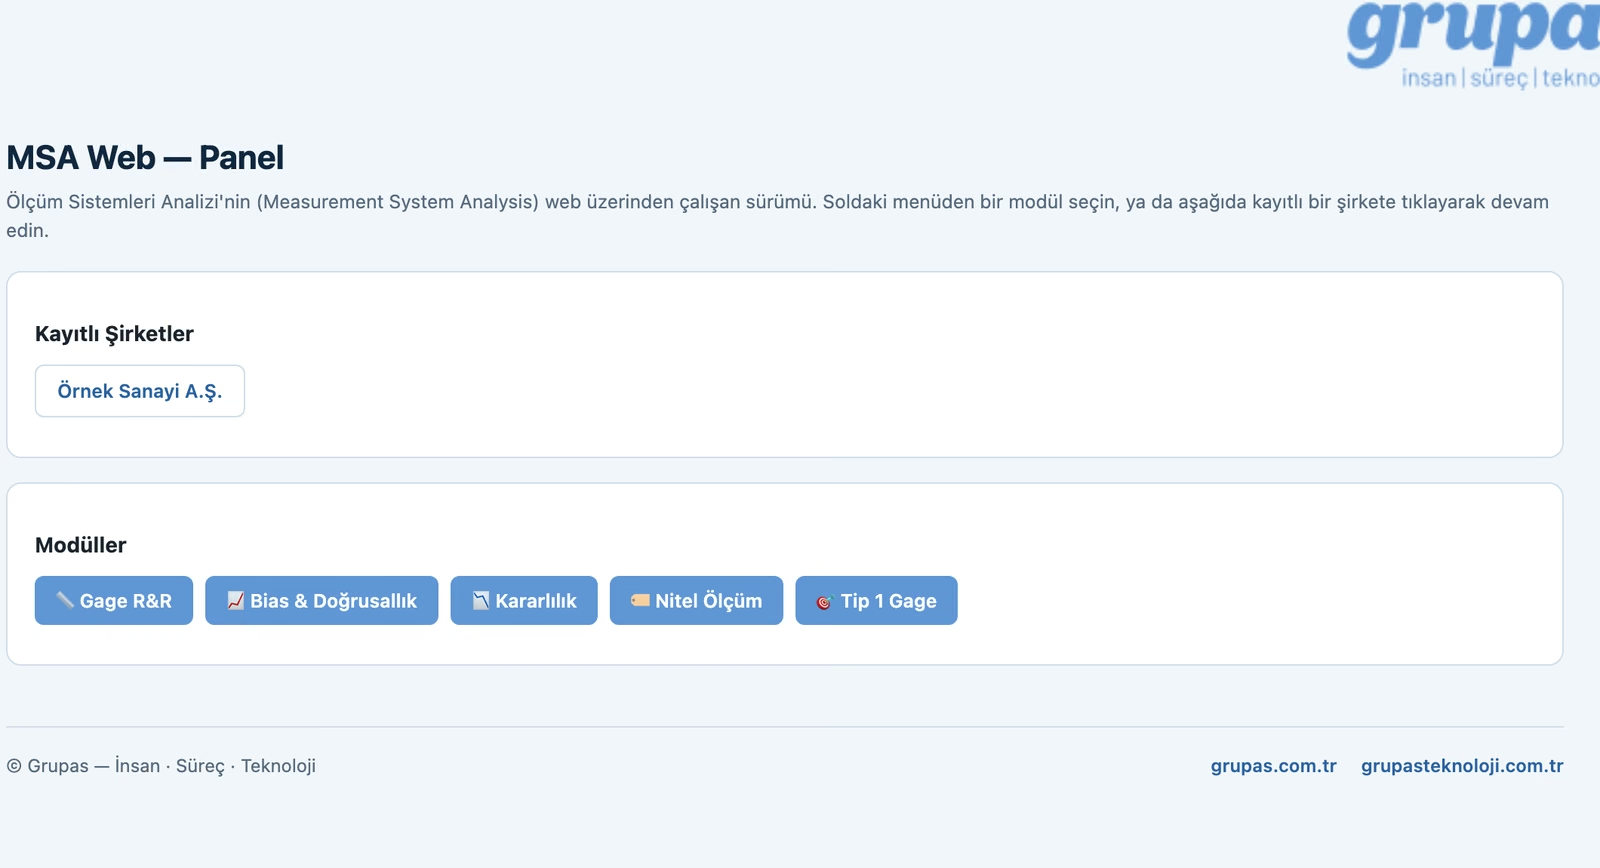
Open MSA from Grupas Core Tools; reach Gage R&R, Bias, Stability, Attribute and Type-1 studies from one panel.
-
2
Create a study
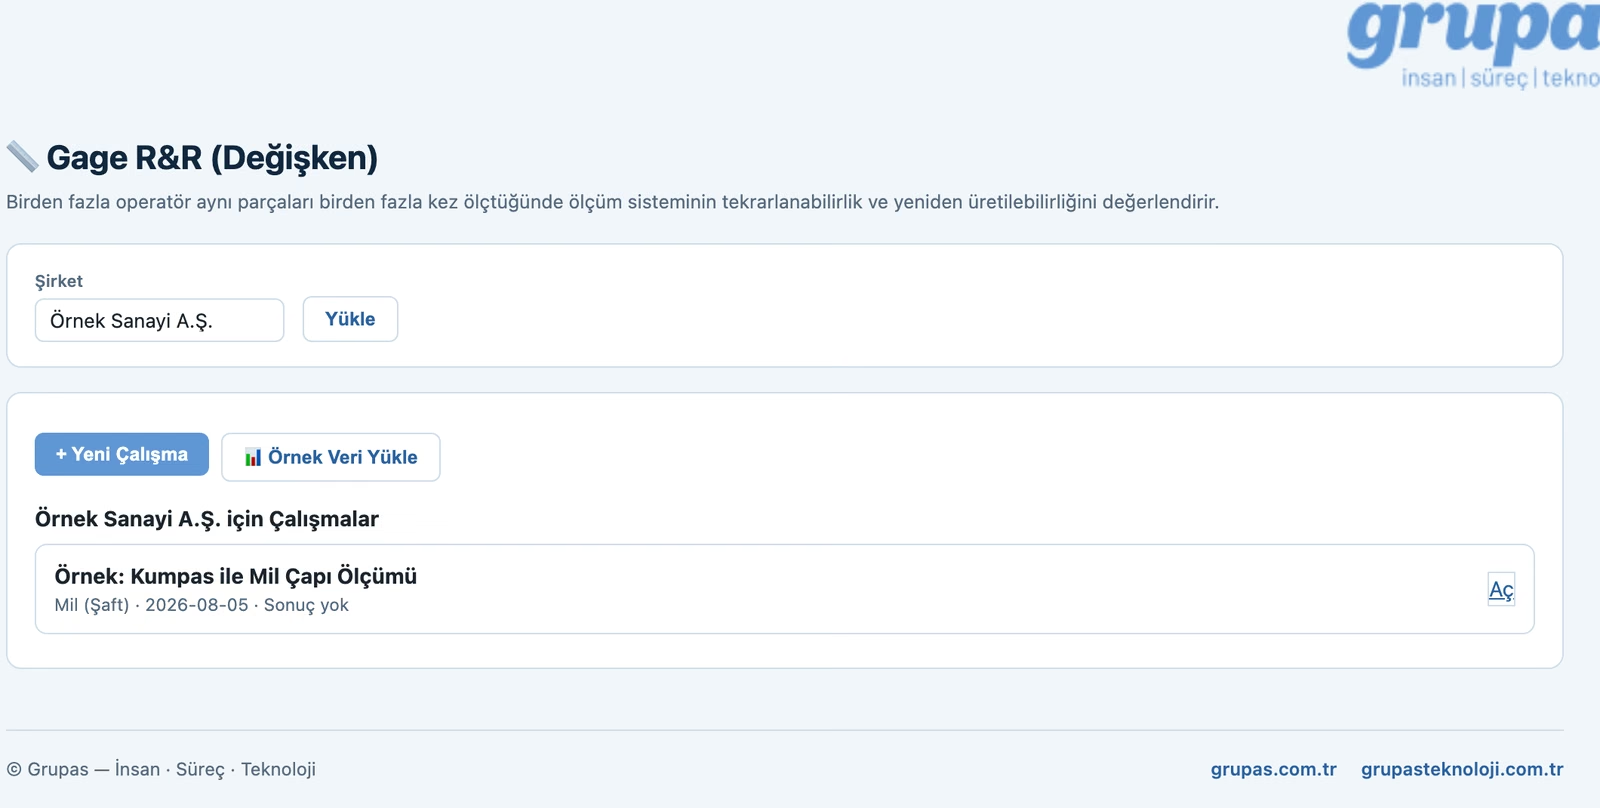
Enter your company, choose the study type; start from scratch or try ready sample data.
-
3
Enter measurement data
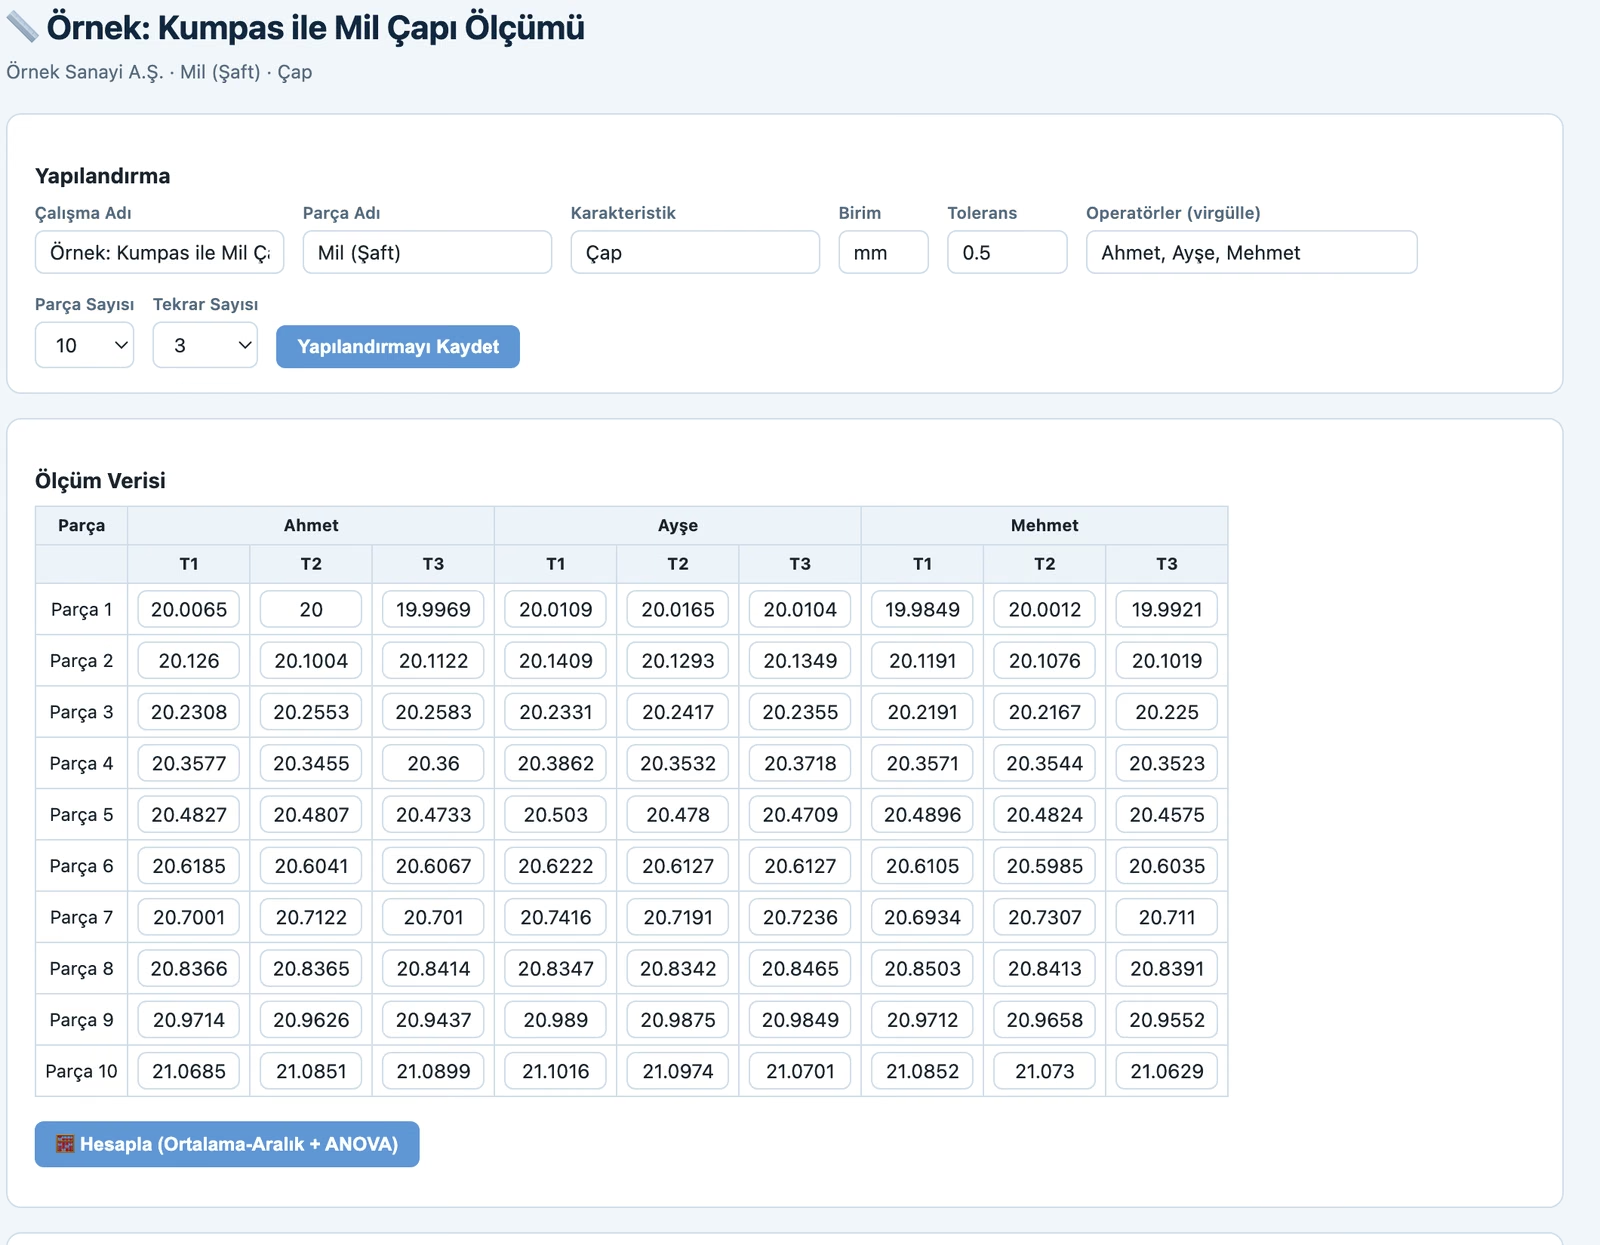
Set operators, parts and trials and enter the readings; an automatic part × operator × trial grid is built.
-
4
See the results
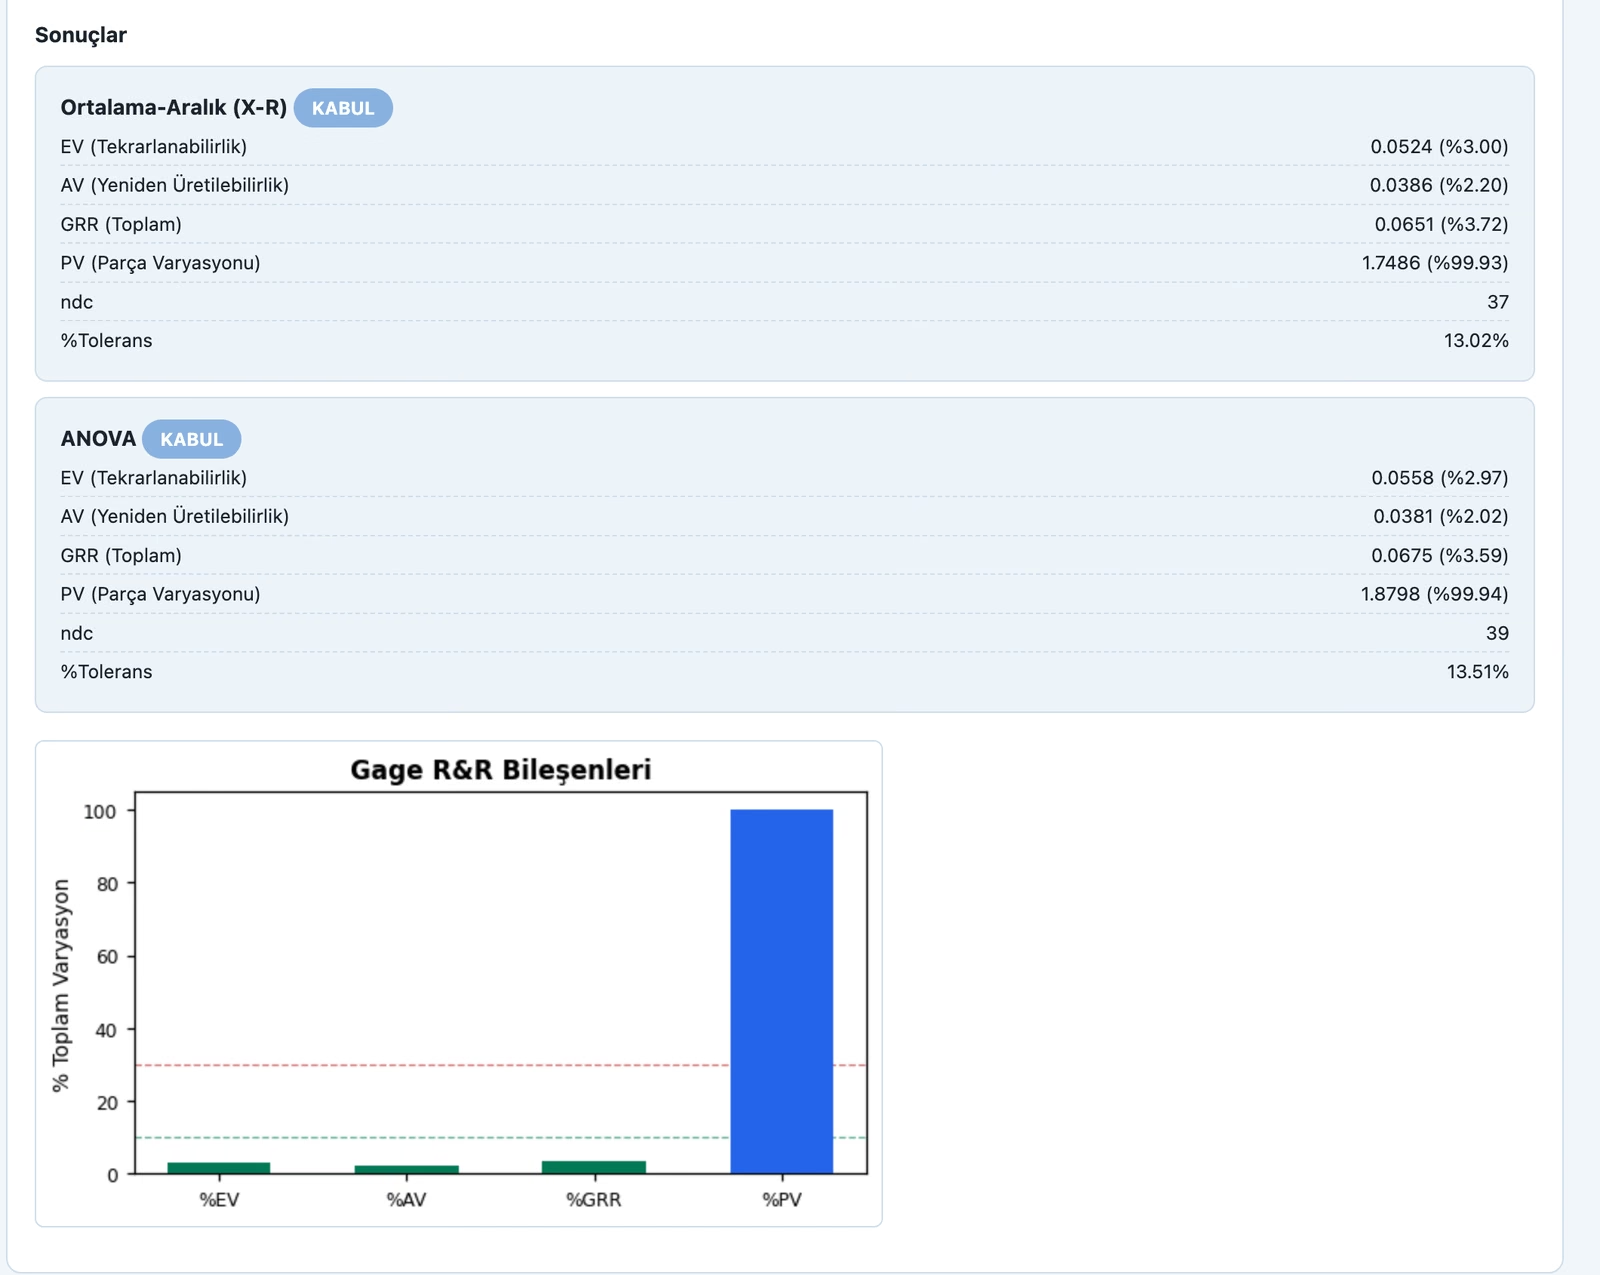
%EV, %AV, %GRR, %PV, ndc and %Tolerance are computed with both Average-Range and ANOVA; accept/reject is judged automatically and shown on a component chart.
-
5
Assess and report
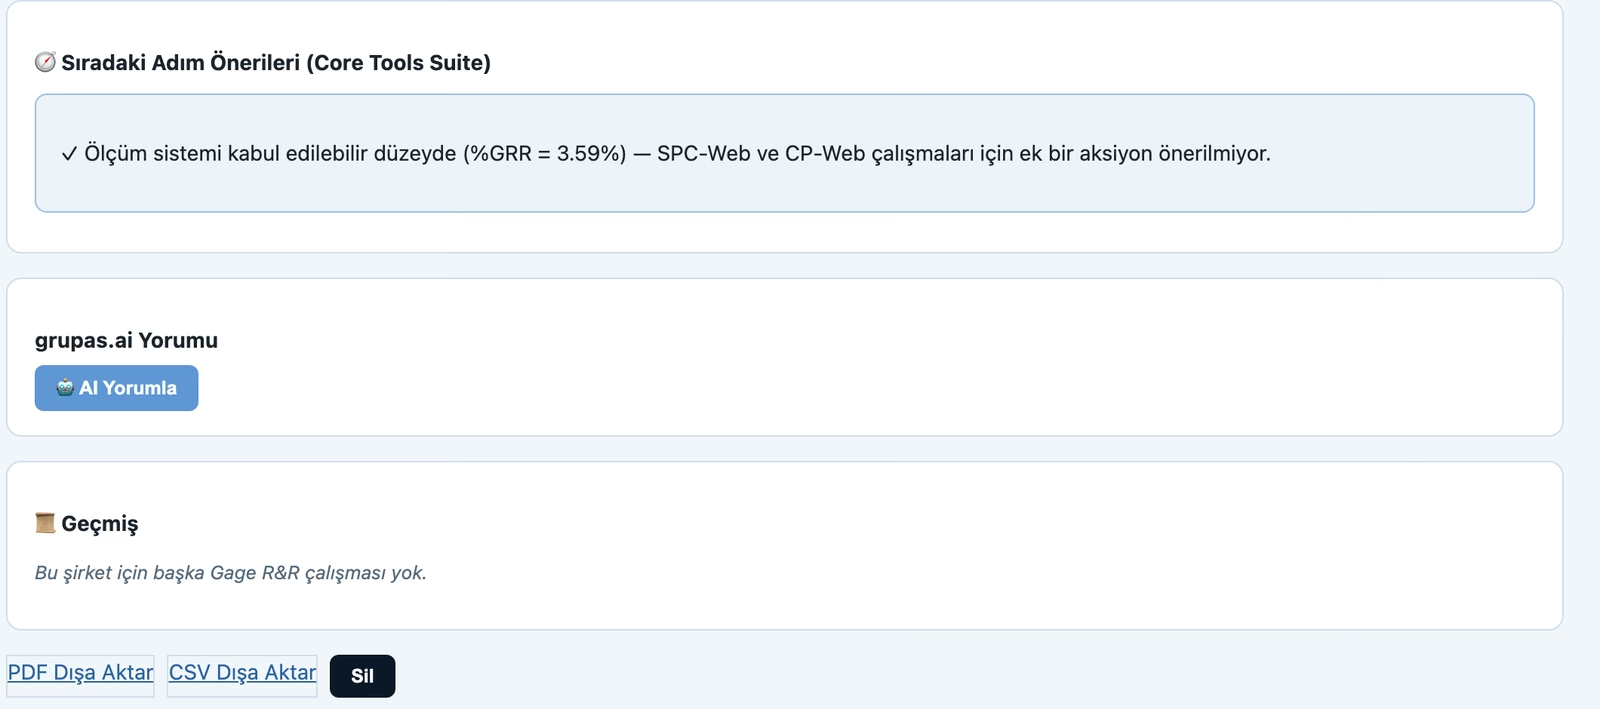
Get a grupas.ai comment, see SPC/CP integration suggestions; export the result as PDF or CSV.
Purpose
Following «you can't manage what you can't measure», it assures the accuracy of the data behind your decisions and separates real variation from measurement error.
Key functions
- Gage R&R (repeatability/reproducibility)
- Bias and linearity analysis
- Stability monitoring
- Attribute MSA
- %GRR, ndc and graphical outputs
Benefits
- Prevents wrong decisions from bad measurement
- A solid basis for SPC and Cpk studies
- Meets audit and customer requirements
Who is it for?
Quality and metrology teams; laboratory and production measurement.
Let's run this assessment in your team
We'll tailor and report it to your needs and roles. Let's schedule a short call.
Get in Touch