
VSM
Map the value stream, see the waste, design the future.
VSM lets you map your value stream with a drag-and-drop diagram editor and visualize current and future states.
Advantages of using it digitally
- Drag-and-drop editor; a digital map instead of paper and whiteboards.
- VA/NVA times and process cycle efficiency (PCE) are calculated automatically.
- Current and future state saved; easy to revise and share.
- Kaizen opportunities and the flow become visible on one screen.
How it works
Map your value stream end to end — from symbols to flow metrics and the future state.
-
1
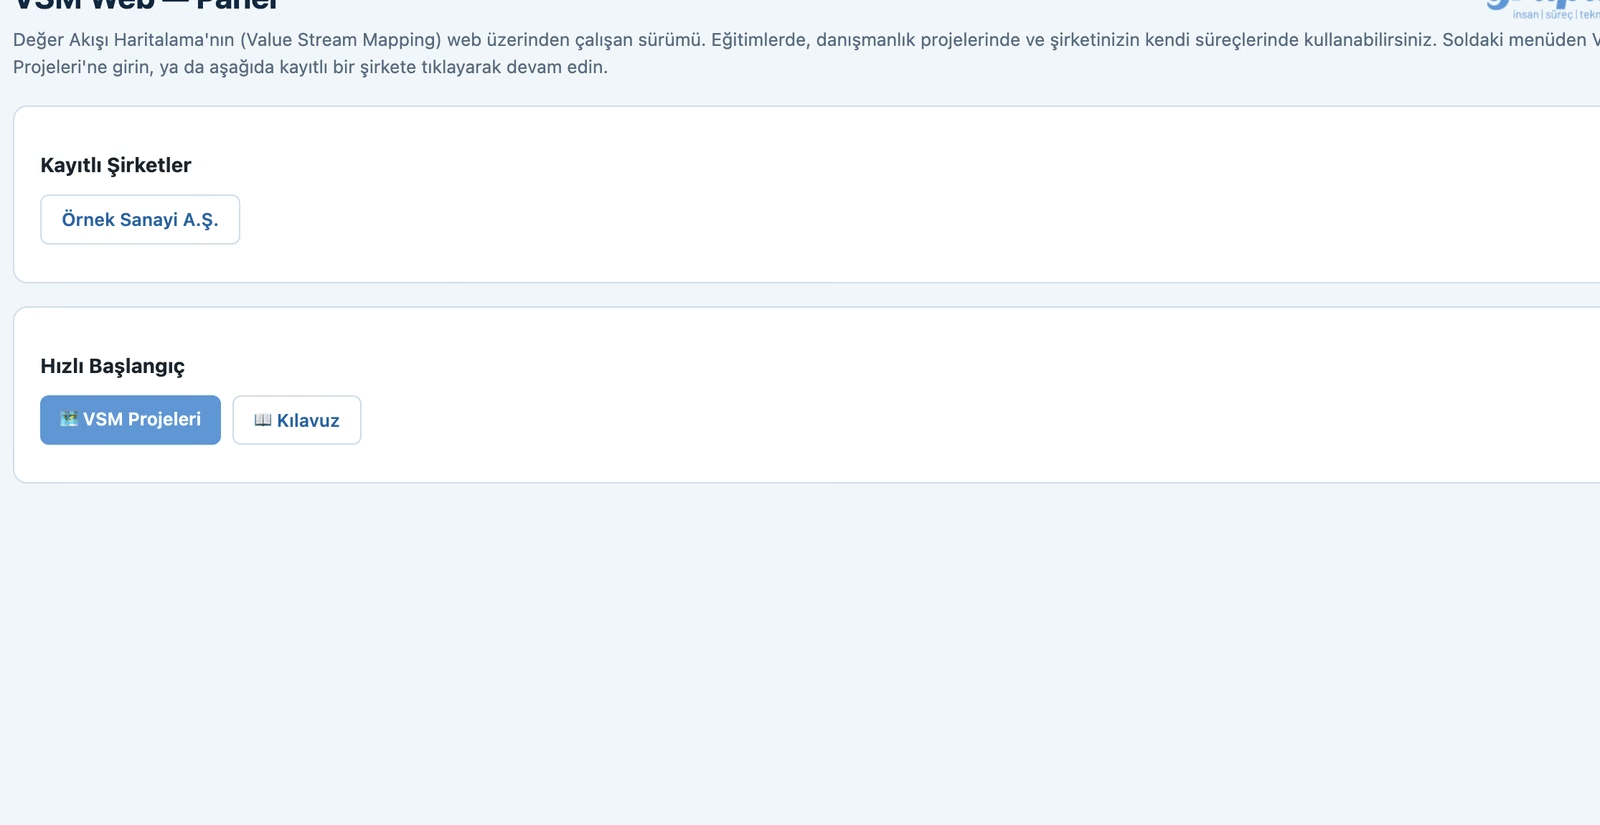
Open the panel
Open VSM; manage your value stream mapping projects from one panel.
-
2
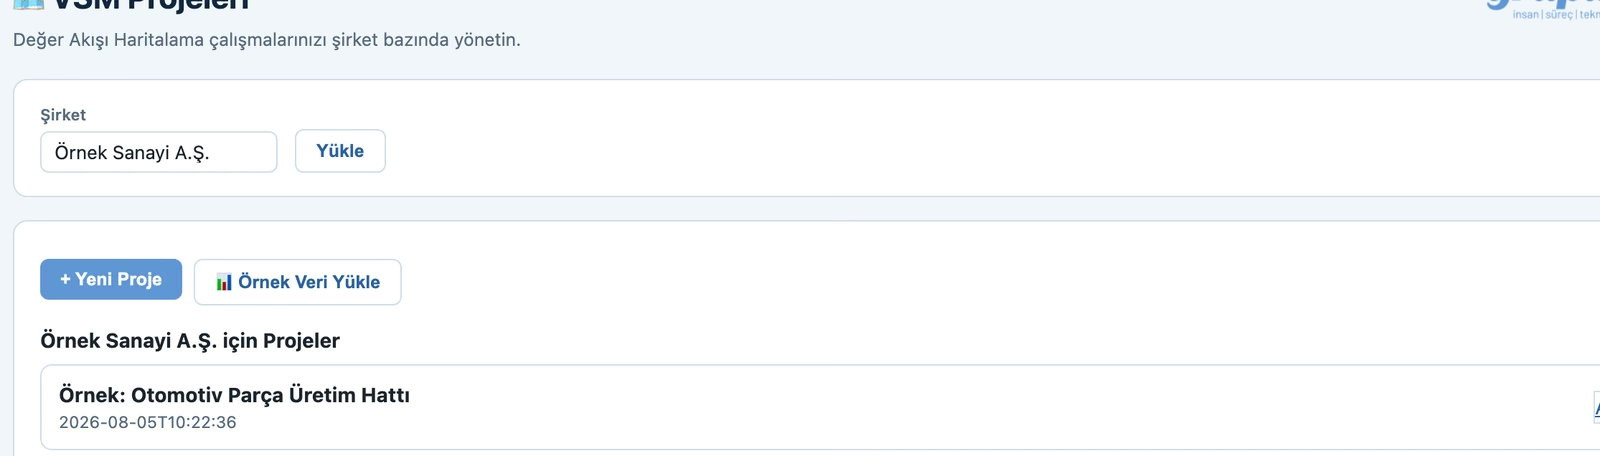
Create a project
Enter your company, create a new project or try ready sample data.
-
3
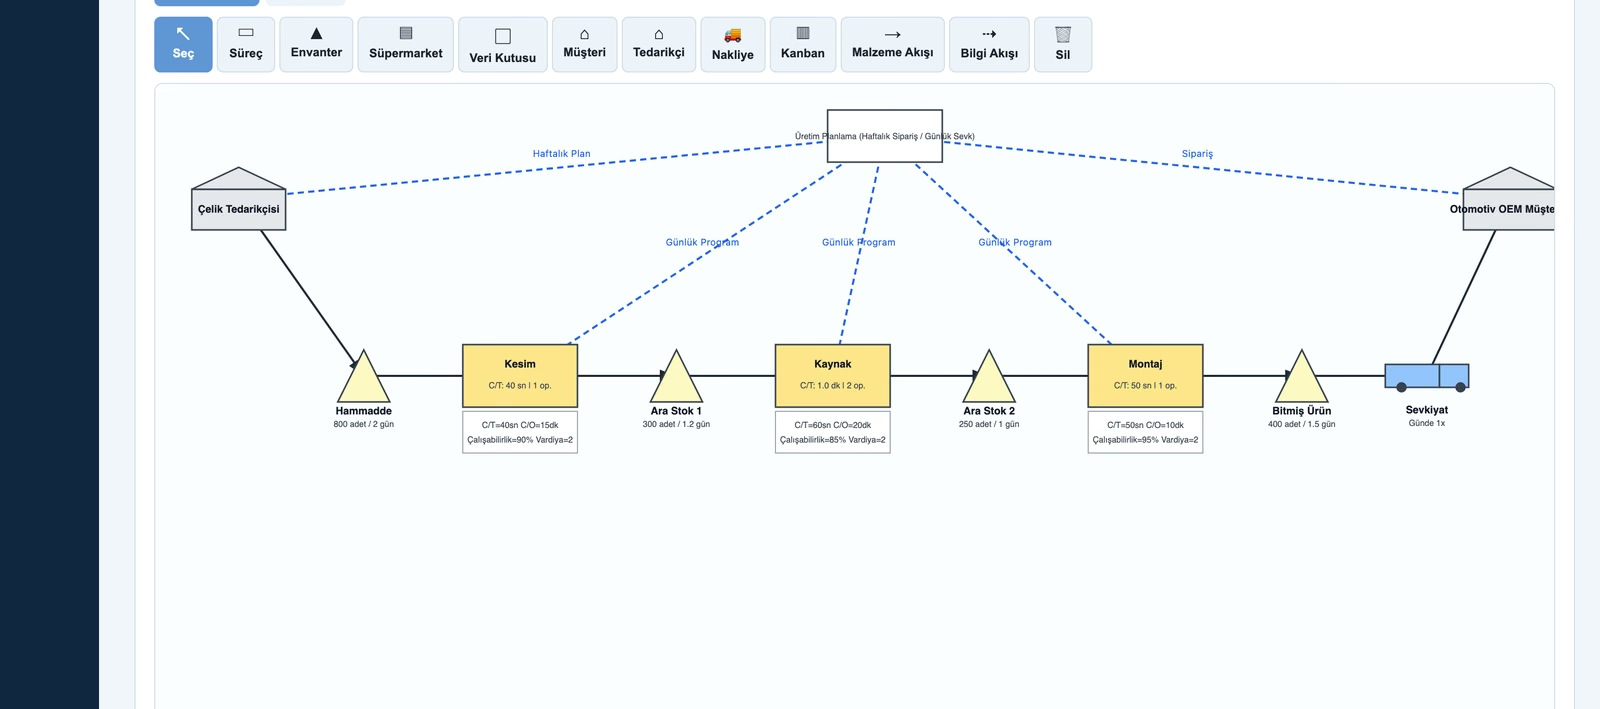
Map the value stream
Draw your current-state map by dragging and dropping process, inventory, supplier, customer, material- and information-flow symbols; enter C/T, C/O and availability data on each node.
-
4
Read the flow metrics
Total lead time, value-added time, PCE (process cycle efficiency), takt time and the bottleneck station are computed automatically.

-
5
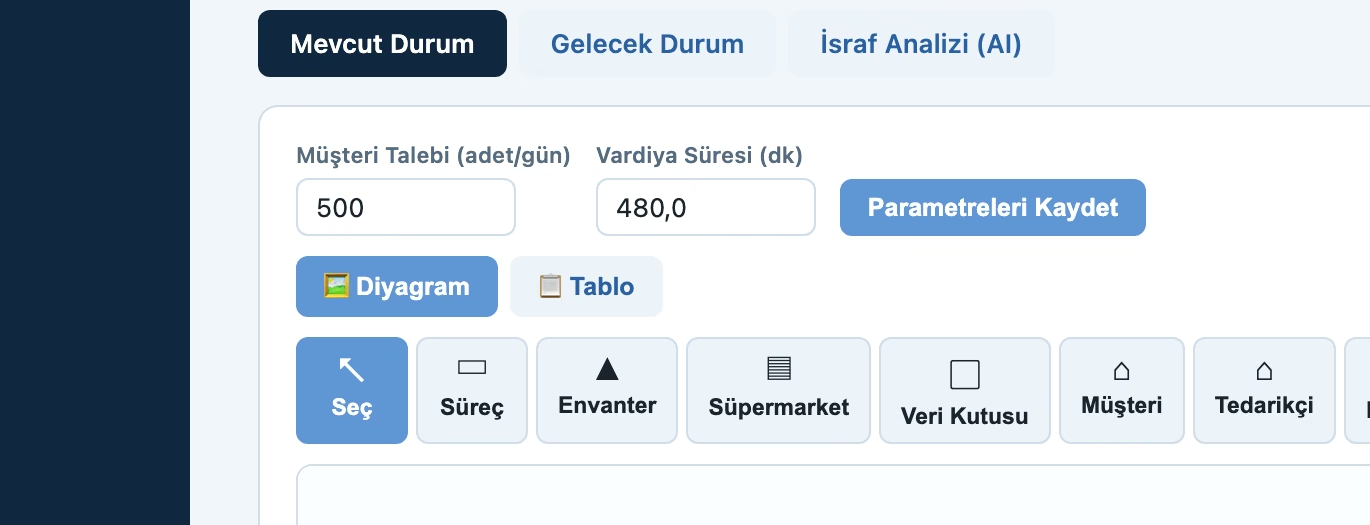
Design the future state & analyze
Build the improved map on the Future State tab, get waste/bottleneck suggestions from grupas.ai via Waste Analysis (AI), and export current/future states as PDF.
Purpose
To make end-to-end waste (waiting, inventory, transport) visible, shorten lead time and improve flow.
Key functions
- Drag-and-drop process boxes
- Timeline (VA/NVA) and PCE
- Material and information flow
- Current / future state map
- Kaizen (improvement) bursts
Benefits
- Shortens lead time
- Makes waste visible and reduces it
- Prioritizes improvement
Who is it for?
Lean/OpEx teams, production and process management.
Let's run this assessment in your team
We'll tailor and report it to your needs and roles. Let's schedule a short call.
Get in Touch